In Tj. Plomp, J. M. Pieters & A. Feteris (Eds.), European Conference on Educational Research (pp. 1149-1152). Enschede: University of Twente.
1992 European Conference on Educational Research (ORD) Enschede
abstract + summary + paper + letters Coleman
The first year examination as negotiation; An application of Coleman's (1990) social system theory to law education data.
Ben Wilbrink
Center for Educational Research, University of Amsterdam.
summary
Law students at the University of Amsterdam in their first year of study typically invest only 800 hours in the first year examination, using the other 800 hours for leisure activities. Yet marking is not lenient: the attrition rate is very high, and a high proportion of 'unsatisfactory' marks is given in each of the six parts of the examination. Obviously there are some inefficiencies in this educational system. Obviously, because this situation repeats itself from year to year, individual actors involved do not have any influence on it, nor do policy makers. The question to be answered by the educational researcher is, given data on time expenditure and marks received, to describe this kind of educational system in terms that open up possibilities to manipulate the situation in the direction of higher efficiency. This kind of description is exactly what the paper will present, using a social system model as recently presented by Coleman (1990), and a data set obtained from the already mentioned first year examinations in law, in the years 1983-1989. (The methodological aspects and implications of the Coleman model are treated and discussed in a companion paper 'Modelling the connection between individual behavior and macro-level outputs.')
The first year examination in Dutch higher education typically is subdivided in several tests, in the case of the study of law there being six tests, the first two scheduled after the end of the first trimester, the other four during the latter part of the third trimester. The examination result is determined by the results of the separate tests, the marks of every test must be satisfactory, some compensation of lower marks by higher marks being allowed. The Dutch scale for marks runs from 1 to 10, all marks below 6 being 'unsatisfactory', and a '10' being the best mark.
The actors in this social system are the teachers and the students. Students, by preparing for the tests, exchange time for marks. The teachers can be seen as exchanging marks for time spent. The exchange of time and marks is only indirect, the test itself functions as a clearing house for the exchange.
Now suppose there exists a general exchange rate of marks and time in this system; for example: to get an 11 % higher mark an arbitrary student has to invest or 'pay' 7 % of his time budget. Now students are free to invest as much or as little time as they wish, knowing perfectly well that spending more time on their study and less on leisure activities will result in higher expected marks. Time spent on leisure activities as well as marks received will give the student a certain satisfaction, the relative amount of satisfaction depends on the amount controlled (possessed or consumed) of the particular good (marks) or resource (time), and the interest the person has in the good or resource. These interests are a personal characteristic of the student. The same can be said of the other (type of) actor in this social system: the teacher. An important assumption on human behavior, one that is routinely made in the field of micro-economics, is that an actor is less and less willing to exchange still more time for marks (in our case) the higher his or her expected mark gets. Now assuming that actors do maximize the satisfaction they derive from marks received and time spent in leisure, it is possible, given the interests of the students and the amount of time they have before any exchanges take place, to determine the time individual students will spend in preparation for their tests.
Interests can not be observed, but it is possible to work the other way around, from the available data on marks and time spent in preparation for the tests to the interests of the actors. Remember the assumption of a general exchange rate of marks and time. Under the existence of a general exchange rate, everybody pays the same price for a particular good, say marks, and gets the same price for, say, time in exchange of marks. The social system then functions like a market where none of the players individually is able to influence exchange rates. From observations on time and marks it is then possible to determine the exchange rate, or the relative values of marks and time. Table 1 gives the values of marks for each of the six tests, in each of six years. The values of time simply are 1 minus the value of marks.
__________________________________________________________________
    test     1983/4   1984/5   1985/6   1986/7   1987/8   1988/9
----------------------------------------------------------------
     1        0.36     0.39     0.40     0.38     0.40     0.38
     2        0.42     0.39     0.39     0.35     0.34     0.37
     3        0.43     0.43     0.46*    0.48*    0.51     0.48
     4        0.41     0.43     0.41     0.44     0.38     0.41*
     5        0.36     0.35     0.33     0.32     0.38     0.36
     6        0.37     0.30     0.27     0.27     0.31     0.26
----------------------------------------------------------------
examination:  0.40     0.39     0.38     0.38     0.39     0.38
__________________________________________________________________
TABLE 1. The values of marks 1983/54 - 1988/9 for 6 tests, and the examination.
Notes: value of time spent = 1 - value of marks; N (students) = 109, 140, 88, 120, 106, 96 resp. over the years; only the students participating in all 6 tests; for three *-marked tests no questionnaires were received, the reported values were derived from estimations of the missing data.
The examination itself can be regarded as a social system in a more comprehensive analysis. Here the student has a budget of, say, 1440 hours, to be spent on each of the tests, or on other study activities, leisure activities or work. The values reported in the row marked 'examination' were computed in an analysis with the teachers corresponding to each of the six tests, and the students, as actors.
The values are very stable over the years. The somewhat lower values of the very last test might be explained from the possibility of compensation: students having good marks on other tests might risk to get only a '5' on this one).
However, the interpretation of differences between values of marks for different tests or different years is not the most interesting use that can be made of this particular model. The computation of values is only the starting point of the analyses. The point is that the model makes it possible to construct a conceptually very different set of new variables from the known set of data on time spent and marks received. The new variables are individual characteristics, like the interests of individual students in marks and in time, and characteristics of the system, like the values, but also the particular distribution of interests over students. Also the model differs from traditional methods of data analysis, because it is now possible to generate predictions of the behavior of the system, and of the individuals in the system, when there are particular changes in available budgets, or when the group of students is selected on particular characteristics. In this way it might be possible to characterize the sub-group of drop outs as differing in certain respects from the group represented in Table 1. Of particular concern is the role of the test as a clearing house for the exchange of marks and time: clearly test results must be predictable for the individual student, otherwise investing time in preparation for the test can not be seen as resulting in higher expected marks. Many interesting analyses remain to be done, some of them to be reported on in the paper. Also there are additional data available on the marks expected by the student, and on time spent in class and in group work.
What will be highlighted in the paper is the competitive character of this educational system. It is not just the teachers who are competing with each other for the time of the students, but also the students are competing with each other for the scarce resource called 'marks'. Drop out rates and grade retention rates, as characteristics of the educational systems involved, depend in complex ways on the behavior of individual actors. Social system theory, in contrast to traditional linear models for data analysis, allows individual actors to compete with each other, it does not assume that individual actors are independent of each other. This theory might be used to unravel the
perennial problem in educational research: the relation between individual actions at the micro-level, and educational outcomes at aggregate levels. Educational assessment is a prime example: lacking absolute standards, assessment is done on a relative basis. Where teachers use relative norms, educational innovations cannot possibly result in better examination results. The reverse may also be true: teachers using relative norms in the grading of students may loose control over the situation, resulting in study delay and attrition.
The application of Coleman's social system theory to examinations, or the combination of tests comprising the particular examination, results in a meaningful description of this educational system. Such a description might be an excellent basis for the application of more prescriptive models, such as Van Naerssen's (1974) model that precribes what optimal strategic behavior of students is, given a particular testing situation.
The work presented will be discussed in several ways. First, does this kind of data analysis result in a meaningful connection of the micro-level and the system-level (what the theme-coordinators call the meso-level)? Second, what further research hypotheses does the presented analysis generate? (for example: concerning the use of the Van Naerssen prescriptive model). Third, what policy advice is immediately evident from the analysis as presented?
In the discussion the results of the social systems analysis will be contrasted with earlier advice on examination policy, given to the department of law, and that has stimulated discussion within the University of Amsterdam about examination procedures. Some remarks will be made about the 'Self-evaluation project', the project that generated the data reported on above, because it is related to the actual debate on the possibilities of advising particular students to drop their study, given poor test results during their first year. The project was meant to give the students some insight into their academic situation at the end of their first year of study, using data they themselve provided on marks expected and time spent, and related to marks received (see Voorthuis & Wilbrink, 1987, chapter 4, for a summary report on the project).
Literature
Coleman, J. (1990). Foundations of social theory. Cambridge, Massachusetts: The Belknap Press of Harvard University Press.
Naerssen, R. F. van (1974). A mathematical model for the optimal use of criterion referenced tests. Nederlands Tijdschrift voor de Psychologie, 29, 431-445.
Voorthuis, M., & B. Wilbrink, (1987). Studielast, rendement en functies propedeuse. Relatie tussen wetgeving, theorie en empirie. Deelrapport 2: Evaluatie-onderzoek Wet Twee-fasenstructuur. Amsterdam: SCO.
1992 European Conference on Educational Research (ORD) Enschede
abstract + summary + paper + presentation + sheets + letters Coleman
The first year examination as negotiation; An application of Coleman's (1990) social system theory to law education data.
Ben Wilbrink
Center for Educational Research, University of Amsterdam.
ECER, june 25 1992
A perennial problem in educational research is the relation between individual actions at the micro-level, and educational outcomes at aggregate levels. Educational assessment is a prime example: lacking absolute standards, assessment is done on a relative basis. Where teachers use relative norms, educational innovations cannot possibly result in better examination results. The reverse may also be true: teachers using relative norms in the grading of students may lose control over the situation, resulting in study delay and attrition. Law students at the University of Amsterdam in their first year of study typically invest only 800 hours in the first year examination, using the other 800 hours for leisure activities. Yet marking is not lenient: the attrition rate is very high, and a high proportion of 'unsatisfactory' marks is given in each of the six parts of the examination. Obviously there are some inefficiencies in this educational system. Obviously, because this situation repeats itself from year to year, the individual actors involved do not have any leverage on it, nor do policy makers. The question to the educational researcher is, given data on time expenditure and marks received, to describe this kind of educational system in terms that open up possibilities to manipulate the situation in the direction of higher efficiency. This kind of description is exactly what the paper will present, using a data set obtained from the already mentioned first year examinations in law, in the years 1983-1989. The recently published social system theory by James Coleman is used to describe the educational system as represented by the dataset. Coleman himself illustrates his theory using a similar set of data on the exchange of time spent and marks received in high school. "Pairwise exchanges in social life do not take place in a vacuum. (...) Also, the exchange rate that exists for a particular high-school student between grades and school performance depends not only on the student's interest in grades and the teacher's interest in the student's performance, but also on the performance of other students (the competition among students for grades) and the alternative uses for the student's time (the competition among activities for the student's time)." (Coleman, p. 131). The Coleman-type of model and its methodological aspects are discussed in a separate ECER-paper in the theme 'Research methodology and evaluation research' (Wilbrink, 1992).
description of location en data
On request of the Department of Law data were collected on the marks expected by the students and the time spent by students in attending lectures and seminars, and in preparing for the tests in the first year of their study of law. During the years 1983 - 1988 immediately before every test a one-page survey was filled out by the students. Students were given feedback on the results of the surveys, also in relation to the marks obtained. (A description of this project, and a parallel one at the institute of dentistry, is given in Voorthuis & Wilbrink (1987, chapter 4)).
Figure 1 gives an impression of the information available from this project.
Figure 1
Mean number of hours spent in preparation for six tests in the first year
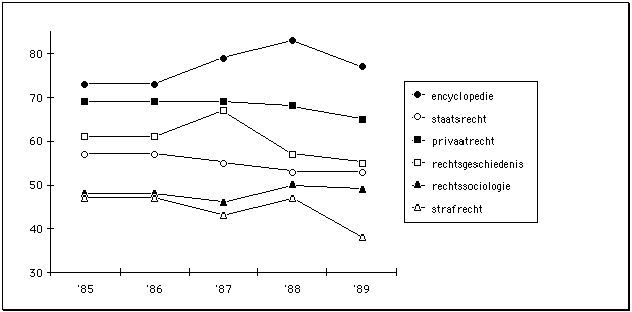
Note. The English equivalents of the names of the tests are resp. General Introduction, Constitutional Law, Private Law, History of Law, Sociology of Law, and Penitentiary Law. This figure does not contain data on the year 1983/84.
For the analyses in the paper a subset of the data will be used, from a group of 179 students for whom a complete set of data on all six tests is available. This group is not representative for the general law student, but the analysis will demonstrate the potential usefulness of Coleman's system model for the description of this educational system. Data were collected from 39 tests in 7 consecutive years; for 3 tests where no survey data are available, the missing data were estimated using information on other tets for the students concerned, and from the preceding year to establish mean scores.For the drop-out study a small group of 45 studentsis used; these students participated only in the first two tests of the series of six, and who filled out the survey.
The first year examination in Dutch higher education typically is subdivided in several tests. In the case of the study of law there are six tests, the first two scheduled after the end of the first semester, the other four during the latter part of the second semester. The examination result is determined by the results of the six tests, every test 's mark must be satisfactory, some compensation of lower marks by higher marks being allowed. The Dutch scale for marks runs from 1 to 10, all marks below 6 being 'unsatisfactory', and a '10' being the best mark. The time budget for the six tests together is 1440 hours, 320 hours for the general introduction, 200 or 240 hours for each of the other tests; the budget includes time for lectures and seminars.
At the system level it is evident from the raw data that students are investing in their study approximately half of the number of hours they are expected to (by law), and that only a small minority have passed the first year examination 'in time'. The situation is stable, in the sense that over the (observed) years no appreciable changes in the statistics have taken place, see Figure 1 for an example. The amazing thing is that the individual student is almost always able on the cost of a relatively small extra investment of time to pass the examination without repeating any test, should he or she wish to do so. However, the number of students wishing to do so must be small, witness the data.
The method to collect data on time expenditures does not seem very reliable: students give very global answers to global survey questions. This measure of time is not objective, in the sense time by the clock is objective, but it is a subjective measure, it is time expenditure as experienced by the students. Faculty in the Department of Law have always had their doubts on the reliability of these data, but figure 1 demonstrates that the aggregated data must be very reliable given de consistent way the tests are differentiated from each other. Data on time expenditure of students are very scarce, especially so in the case of observations over several years. (Voorthuis & Wilbrink (1987, chapter 2) present data on Dutch research and the methods used in this kind of research).
Table 1
Relations between the empirical variables
________________________________________________________________________________________________
test/  m.  s.d.  general      constitutio-  private      history     sociology     peniten-
                 introduction   nal law       law        of law       of law      tiary law
vari-            -----------  -----------  -----------  -----------  -----------  ----------
able              1   2   3    1   2   3    1   2   3    1   2   3    1   2   3    1   2
______________________________________________________________________________________________________
general introduction
 1   6.85  1.39
 2   6.27  0.80   34
 3 161    47      21  14
constitutional law
 1   6.68  1.47   49  34  27
 2   6.11  0.84   18  51  15   36
 3 121    42      15  16  72   26  15
private law
 1   6.45  1.53   43  37  14   54  32  24
 2   6.10  0.85   34  66  16   40  55  16   48
 3 126    46      10  18  70   18  14  75   25  18
history of law
 1   6.34  1.61   49  35  16   54  36  10   53  43  12
 2   5.92  0.82   23  53  21   29  38  18   30  58  18   45
 3  90    37      15  14  67   20  11  69   21  16  77   24  21
sociology of law
 1   6.45  1.37   43  40  11   52  37  13   48  42  09   55  35  16
 2   5.92  0.95   15  44  03   22  28  11   22  50  05   19  43  16   37
 3  70    34      05  20  60   17  14  69   04  11  74   14  21  72   16  10
penitentiary law
 1   7.03  1.67   31  33  22   48  34  18   45  40  15   51  34  18   52  19  21
 2   6.36  0.96   20  44  07   29  48  07   28  64  05   23  43  09   29  55  07   41
 3  88    39      08  18  55   17  10  68   14  13  72   07  17  69   01  06  72   16  01
______________________________________________________________________________________________________
Note. 1 = mark obtained, 2 = mark expected, 3 = total of hours spent, m. = mean, s.d. = standard deviation; correlations are written without decimals.
Differences in time spent correlate meaningfully with one another: Table 1 presents correlations between time spent on different tests. Doubts may also exist on the reliability of the marks students say to expect. The marks as obtained are absolutely valid, in the legal sense, but their reliability and validity might be disappointing. Table 1 presents in a multitrait-multimethod lay-out (Campbell & Fiske, 1959) the interrelations between the empirical variables, not only for each test, but also between different tests ('heteromethods'). Table 1 shows time spent to be only marginally correlated with marks, even less so with expected marks. By the way, this does not at all mean that for the individual student there would not be a meaningful relation between the time he is prepared to invest in the study, and the results he will obtain. The table shows the marks obtained for different tests to be correlated only .5. Remark that the obtained marks for the second test are more highly correlated with expected marks for the first test than the reverse, obtained marks for the first test with the expected marks for the second test. This is a pattern that can be observed for most of the paired tests in Table 5. This peculiar relation suggests that students adapt the time to invest in the study, not the expectations they have: they do not adapt their expectations, but try to improve on their accuracy by better trying to make them come true. This possibility however will not be explored further.
The table may be checked for Campbell & Fiske's criteria for convergent and discriminant validity. (1) Correlations in the validity diagonals, the correlations in the diagonals printed in bold type, are substantial, so there is convergent validity. (2) Almost all correlations in the validity diagonals are higher than correlations in their corresponding row and column.(3a) variables correlate higher with themselves in other tests (diagonal values), than with other variables within the same test (monomethod correlation triangles); (3b) expected and obtained marks represent the same construct but are measured by different methods; they correlate higher than each of them does with time spent. (4) The same pattern of correlations is repeated in off-diagonal and monomethod correlation triangles.
The conclusion of the study on the validity of the collected data is that they are quite suited for further analyses with for example the Coleman system model.
At the end of the year students received feedback on their aggregate results, presented in tables like the one in Figure 2. This figure illustrates how important it is to have a model where explicit consideration is given to the time spent in extra-curricular activities: many students pass the examination in less than half the 1440 hours that formally are available to them.
Figure 2
Relation between marks obtained and time spent for six tests, for three subgroups
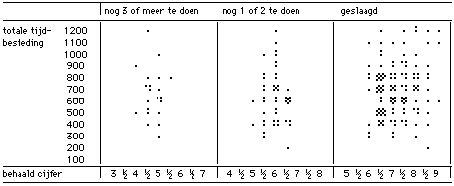
Note. Every dot in the figure represents a student. Some students have not yet done all tests, but at least 4 of them. In the rightmost part the students that have passed the examination. In the middle part students who have to repeat or have still to do one or two tests. In the leftmost part students who have to do and repeat more than two tests. 'behaald cijfer' = obtained mark; 'totale tijdbesteding' = total time spent to study and attend colleges and seminars.
description of the Coleman model and its most important concepts
I will use the applications of the Coleman model to the data as the description that best illustrates the character and import of this model. I will make a few remarks on the way an educational system can be modelled as a market, and then pass on to the applications.
Coleman models the educational system as a market where teachers and students each try to get the best deal possible. The exchanges that are made are exchanges of the time the student has invested in the study, and the mark with which the teacher evaluates the testresult of the student. It is assumed that the market is competitive, meaning that everyone has to pay the established market price, the exchange rate of time and marks. Under this assumption it is possible, given the empirical data, to estimate this exchange rate.
Before any exchange takes place, teachers can be said to have a budget of marks, 10 points for every student participating. The students have a time budget of 1440 hours. Teachers hope to use their marking in ways that result in as high an investment of time by the students as possible. Students have alternative uses for their time, and in fact in the case of the law students will spend a sizeable part of their time-budget in extra-curricular activities. Remark that in the model the time spent outside the study plays an important role. A slightly different assumption was made by Van Naerssen (1974) in his model for educational testing: he assumed students would minimize the time to invest in passing a test or examination. Using the Van Naerssen assumption it is possible to prescribe what will be optimal strategies for a particular student in studying for tests, but it is not possible to derive from empirical data what strategies students in fact are using. This we can do using Coleman's model. By the way, time is a strange resource in the marketplace: it has to be exchanged immediately. Doing nothing means your time budget is being emptied without getting any mark in return (but maybe the student at that moment needs rest most urgently). A student who gets no deadlines posed will have a rough time to get a good bargain on his time.
Next to the assumption of the competitive market it is assumed that students and teachers maximize their satisfaction with what they get from their exchanges. This assumption makes it possible to estimate the relative interest a particular student has in time and in marks. In this way two new variables are constructed from the theory and the available data: the interests and satisfactions of students and teachers.
Isn't all this very vulgar? Isn't education meant to give students a preparation for life, at least to impart qualifications that are valued in society? Obviously Coleman's model will not touch on the higher values of the educationalist. The results of the application of Coleman's model to empirical data might warn the educational idealist that the moves that teachers and students together are making are far removed from the warm intentions citizens and politicians have regarding the educational system. Coleman's model might be a powerful instrument to ascertain empirical reality, it is not meant to illuminate any idealistic world.
applications
The first application is the analysis where marks obtained and prepation time for the test are exchanged. The natural thing to do is to regard the six tests as comprising one educational system. The first row in Table 3 gives the estimated values marks and time have in this six-test system.
Table 3
Values for the two resources time spent and marks obtained
________________________________________________________________________
system analyzed      values
                     ------------------------------------------
                     obtained marks     test preparation time
================================================================
six-test system           .391                .609
_______________________________________________________________________
general introduction      .380                .620
constitutional law        .384                .616
private law               .443                .557
history of law            .399                .601
sociology of law          .346                .654
penitentiary law          .310                .690
________________________________________________________________________
Note. Values sum to 1 (horizontally).
These values are relative to each other, and are chosen so as to sum to one. Where the teacher starts with all the marks available, and the student with all the time, the power of the teacher can be said to be .391, the power of the student .609. The power of an actor is the proportion of every resource he controls, times the value of that resource. These law students can be said to be in a powerful position, relative to their teachers!
Every test or course can itself be regarded as an educational system. The six one-test systems are governed by the values given in de next six rows in Table 3. The power balance between students and teachers differs. The last test in the row, also the last test in the second semester, is the most favorable one for the students, probably because many students are not inclined to invest yet more time in high marks they do not need to pass the examination (having already scored several marks of '7', they would pass with a score of only '5' on the penitentiary law test). The private law test is notoriously difficult, forcing students to a less favourable exchange of their time against the teachers' marks.
The six separate analyses result in six estimates for the interest in marks versus time for every student. The relations of these interests with the empirical variables are presented in Table 4, as are the relations for the satisfaction attained. The results in Table 4, evaluated against Campbell and Fiske's criteria, reveal that the constructed variables have discriminant validity, they are potentially meaningfull instruments for the educational researcher.
In Table 4 the time spent in preparation for the test is seen to be negatively correlated with satisfaction. Remember that students are interested in the time they might spend for themselves, not for the teacher, to put it bluntly. No wonder then that students spending more time on their study tend to be less satisfied. N.B.: satisfaction is subjective, in a strict sense satisfaction and interests of different students can not be compared; nevertheless, analyses where satisfactions are compared might reveal contingencies in the educational system that are not easily seen otherwise.
Table 4
Relations between empirical variables and the constructs 'interest and 'satisfaction'
__________________________________________________________________________________________________________________________________________________________________________________________________________________________________________________________________________________________
test/   m.   s.d.    general introduction constitutional law       private law        history of law      sociology of law    penitentiary law
vari-               -------------------  -------------------  -------------------  -------------------  -------------------  ----------------
able                  1   2   3   4   5    1   2   3   4   5    1   2   3   4   5    1   2   3   4   5    1   2   3   4   5    1   2   3   4
____________________________________________________________________________________________________________________________________________________________________________________________________________________________________________________________________________________________

general introduct.
 1   6.85    1.39
 2   6.27    0.80     34
 3  79      36        15  10
 4   0.411   0.129    58  25  84
 5   0.0035  0.0007   46  14 -70 -23
constitutional law
 1   6.68    1.47     49  34  23  40  11
 2   6.11    0.84     18  51  12  19  01   36
 3  63      32        15  14  63  56 -35   24  17
 4   0.419   0.161    34  26  60  67 -17   57  25  87
 5   0.0034  0.0007   24  14 -26  01  45   40  10 -60 -17
private law
 1   6.45    1.53     43  37  12  26  13   54  32  21  32  08
 2   6.10    0.85     34  66  09  22  11   40  55  16  25  13   48
 3  72      33        10  16  54  46 -37   18  17  63  51 -42   30  19
 4   0.528   0.189    22  27  51  50 -25   31  24  62  57 -29   52  30  93
 5   0.0030  0.0007   24  16 -24 -05  41   25  10 -21  00  44   41  14 -52 -23
history of law
 1   6.34    1.61     49  35  13  33  17   54  36  11  28  25   53  43  15  26  26
 2   5.92    0.82     23  53  14  20 -01   29  38  19  22  01   30  58  17  23  07   45
 3  61      28        14  12  58  50 -37   20  15  61  53 -35   21  17  68  61 -34   25  19
 4   0.426   0.161    34  24  49  56 -16   41  27  46  52 -05   37  28  53  54 -07   64  29  85
 5   0.0032  0.0007   20  12 -35 -13  47   21  09 -44 -21  58   16  14 -52 -36  61   40  06 -65 -20
sociology of law
 1   6.45    1.37     43  40  07  28  23   52  37  12  33  29   48  42  11  25  32   55  35  18  39  24
 2   5.92    0.95     15  44  03  09  07   22  28  13  16  04   22  50  04  11  12   19  43  18  23  05   37
 3  48      26        04  22  48  39 -32   14  19  63  55 -37   04  13  65  58 -37   10  22  65  49 -51   16  13
 4   0.341   0.129    23  35  36  41 -09   35  33  54  62 -08   24  28  49  52 -05   30  32  55  55 -23   57  24  82
 5   0.0036  0.0007   21  02 -36 -15  43   13  05 -43 -22  55   20  10 -53 -37  59   15 -02 -47 -22  62   33  03 -76 -29
penitentiary law
 1   7.03    1.67     31  33  21  34  06   48  34  20  36  17   45  40  15  25  24   51  34  21  41  18   52  19  19  36  07
 2   6.36    0.96     20  44  11  18  03   29  48  15  20  06   28  64  09  16  10   23  43  16  24  08   29  55  13  25  05   41
 3  47      25        07  19  36  30 -23   18  16  57  49 -35   11  15  58  52 -25   12  19  53  42 -34   05  10  70  59 -46   19  11
 4   0.307   0.116    27  31  36  43 -05   39  29  49  57 -04   33  30  45  49  09   37  28  47  54 -06   37  15  59  69 -15   66  27  78
 5   0.0039  0.0006   20  02 -12  05  29   14  07 -34 -14  50   18  11 -39 -25  51   21  00 -28 -03  51   34  03 -43 -14  58   38  12 -66 -10
__________________________________________________________________________________________________________________________________________________________________________________________________________________________________________________________________________________________
Note. 1 = obtained mark, 2 = expected mark, 3 = hours of preparation for the test, 4 = interest in obtained mark (the complement is the interest in time), 5 = satisfaction, m. = mean, s.d. = standard deviation; correlations are written without decimals.
Interests and satisfaction are personal characteristics, also for the teachers behind the six tests. Table 5 gives the results for the analysis of the six-test system, where teachers are also pitted in competition against each other. Competition here is for the time of the student. The student has a time budget in the six-test system of 934 hours, and is free to distribute his time any way he wishes in the preparation for the six tests. The teachers start with each the same budget of marks, the same power also. After exchanges there are differences in the power of the teachers. Because these differences do not parallel the differences in programmed hours it can be said 'private law' is a winner in this competitive market, 'penitentiary law' a loser. The error terms are related to the differences in power before and after exchange, because the assumption in the model is that exchanges do not affect the power of the actors. The mathematical analysis renders the values for marks and time that minimize the sum of these error terms. The tabulated means of the marks refet to the marks the teachers have not handed out.
Table 5
The six-test educational system: results for the tests
_____________________________________________________________________
                    mean      |  interest   power error2 satis-  time
                   ---------- | -----------              faction pro-
                              |                                 gram-
test / teacher     mark  time |  marks time                       med
---------------------------------------------------------------------
general introduct.  3.15   79 |  .307 .693  .074     82  .075     198
constitutional law  3.32   63 |  .371 .629  .065      0  .065     154
private law         3.55   72 |  .352 .648  .073     60  .073     140
history of law      3.66   61 |  .398 .602  .067      2  .067     142
sociology of law    3.55   48 |  .450 .550  .057     65  .057     140
penitentiary law    2.97   47 |  .413 .587  .052    172  .052     160
_____________________________________________________________________
Note. The values for marks and time are respectively .391 en .609. Error2 is times 106.
using expected marks and other extensions of the analysis
Obtained marks typically are known only after the test is taken. It is difficult to picture the exchange of time against obtained marks, because the student cannot possibly know what this mark will be. The student might know approximately what mark he will obtain, however, and choose his strategy according to what he expects the obtained mark to be. Because empirical data on expected marks are available, the analysis can be repeated for the situation where expected marks are exchanged against time. This will result in higher validities for the constructed variables interests and satisfaction. I do not give here the results of this analysis. There is a small problem with the expected marks: the variance is much smaller than the variance of the obtained marks; also there are many students who tend to over- or understimate their results. It is possible to correct the expected scores for the difference between the means of expected and obtained scores on the six tests. See the parallel paper for the justification of this correction. Applying the Coleman model with corrected expected marks again results in higher validities. The results of this analysis will not be presented either. The next step might be to use the total time spent, that is also the time spent in preparing for and attending lectures and seminars. This analysis is reported in the parallel paper, and it results in higher validities again. The next step can be to separate time spent in preparation for the test from the time spent for lectures and seminars. Table 7 presents the values resulting from these analyses, Table 6 the multitrait-multimethod matrix.
Table 6
MTMM-matrix for variables in the analysis with total time separated in preparation for the test and time spent for lectures and seminars
________________________________________________________________________________________________________________________________________________________________________________________________________________________________________________________________________________________________________________________________________
test/   m.   s.d.    general introduction      constitutional law           private law            history of law           sociology of law       penitentiary law
vari-               -----------------------  -----------------------  -----------------------  -----------------------  -----------------------  --------------------
able                  1   2   3   4   5   6    1   2   3   4   5   6    1   2   3   4   5   6    1   2   3   4   5   6    1   2   3   4   5   6    1   2   3   4   5
________________________________________________________________________________________________________________________________________________________________________________________________________________________________________________________________________________________________________________________________________
general introduct.
 1   6.85    1.39
 2   6.80    1.26     67
 3  79      36        15  18
 4  82      25        18  17  17
 5   0.527   0.115    52  71  67  59
 6   0.0031  0.0005   45  71 -35 -19  17
constitutional law
 1   6.68    1.47     49  71  23  18  57  44
 2   6.63    1.27     57  80  19  16  59  55   72
 3  63      32        15  19  63  26  53 -16   24  21
 4  59      19        08  16  19  79  49 -17   17  12  33
 5   0.543   0.131    39  55  53  53  80  12   52  61  78  62
 6   0.0030  0.0006   41  54 -10 -25  18  68   42  66 -35 -42 -02
private law
 1   6.45    1.53     43  70  12  09  44  47   54  66  21  17  45  33
 2   6.62    1.31     66  86  17  19  61  60   73  82  20  14  52  55   76
 3  72      33        10  21  54  35  52 -18   18  21  63  41  61 -26   30  22
 4  54      22        05  12  22  75  48 -15   10  06  32  76  50 -35   07  09  37
 5   0.533   0.136    38  54  47  58  78  13   45  48  57  58  78 -01   46  58  79  67
 6   0.0030  0.0006   45  53 -08 -38  10  68   46  51 -16 -44 -02  77   35  59 -41 -51 -15
history of law
 1   6.34    1.61     49  73  13  12  51  54   54  73  11  03  41  55   53  76  15  03  42  50
 2   6.44    1.27     60  81  21  21  62  53   68  74  22  14  51  47   65  83  22  10  51  50   80
 3  61      28        14  21  58  28  52 -15   20  23  61  28  56 -13   21  23  68  30  59 -21   25  25
 4  29      17        08  13  15  70  43 -09   10  05  27  72  45 -32   10  11  37  78  58 -41   10  16  31
 5   0.449   0.131    39  54  51  46  76  16   46  49  55  43  72  09   43  54  62  44  76  01   53  65  82  54
 6   0.0032  0.0006   28  35 -26 -37 -08  57   31  33 -38 -43 -24  64   24  35 -50 -46 -31  74   31  38 -60 -49 -29
sociology of law
 1   6.45    1.37     43  70  07  10  46  58   52  68  12  08  42  52   48  70  11  02  38  50   55  66  18  05  42  34
 2   6.44    1.24     58  72  14  10  50  55   67  64  20  11  44  42   64  75  14  06  42  49   66  71  27  10  51  31   73
 3  48      26        04  16  48  32  48 -16   14  14  63  39  59 -25   04  11  65  37  58 -29   10  16  65  33  58 -50   16  12
 4  22      14        06  16  25  54  44 -10   14  11  29  60  45 -24   02  12  40  69  58 -36   16  17  33  71  47 -41   08  12  43
 5   0.347   0.098    35  53  46  39  70  19   48  46  58  43  73  05   35  49  56  45  74  02   44  52  62  44  76 -21   51  62  79  56
 6   0.0035  0.0006   24  18 -32 -39 -23  45   18  18 -39 -48 -33  53   28  25 -54 -48 -40  64   18  17 -43 -47 -31  70   22  33 -76 -65 -41
penitentiary law
 1   7.03    1.67     31  65  21  11  51  44   48  65  20  05  42  44   45  68  15  09  41  42   51  65  21  05  46  29   52  59  19  15  47  09
 2   6.88    1.28     60  73  20  07  52  51   70  75  21  02  45  52   66  82  17  00  44  55   66  72  25  02  47  36   65  74  12  05  48  27   73
 3  47      25        07  17  36  32  40 -11   18  15  57  35  51 -25   11  14  58  37  54 -24   12  17  53  39  52 -40   05  12  70  30  60 -46   19  13
 4  41      21        07  11  17  67  41 -17   10  04  29  71  45 -35   12  09  37  74  54 -43  -03  10  30  76  43 -48  -04  04  37  65  41 -48   07 -04  40
 5   0.340   0.098    41  53  38  32  62  22   50  52  54  30  66  14   43  54  51  33  66  14   42  51  53  34  68 -08   40  47  61  29  76 -19   51  59  82  36
 6   0.0037  0.0006   31  28 -15 -35 -06  46   23  31 -35 -44 -22  64   25  34 -42 -43 -26  68   27  26 -28 -45 -17  68   38  33 -48 -35 -20  66   22  44 -70 -53 -22
__________________________________________________________________________________________________________________________________________________________________________________________________________________________________________________________________________________________________________________________________________
Note. 1 = obtained mark, 2 = expected mark (corrected), 3 = hours of preparation for the test, 4 = hours preparing for and attending lectures and seminars, 5 = interest in obtained mark (interests in both time variables not tabulated), 6 = satisfaction, m. = mean, s.d. = standard deviation; correlations are written without decimals.
Table 7
Values for the analysis with three resources
________________________________________________________________________________________
system analyzed      values
                     ------------------------------------------
                     expected marks   test time    lecture time
________________________________________________________________________________________
six-test system           .372           .738         -.110
================================================================
general introduction      .448           .301          .251
constitutional law        .456           .281          .263
private law               .450           .277          .273
history of law            .412           .427          .161
sociology of law          .354           .447          .199
penitentiary law          .338           .551          .110
________________________________________________________________________________________
Note. The analysis is based on corrected expected marks
As Table 7 shows, one of the values for the six-test system analysis is negative, making it difficult to interpret the results. The analyses for the separate tests reveal the possible reason: the values for both kinds of time are negatively correlated over the series of six tests. Indeed there is a more heavy load of lectures and seminars for the first tests.
The multitrait-multimethod matrix in Table 6 shows the variables in these analyses to have high validities, with the exception of the most important one: obtained marks. This lower validity suggests the quality of the tests might leave room for improvement.
drop-out study
Results until now regard only students having participated in all six tests. The typical drop-out however will have left long before the last test is scheduled. Complete sets of data are available on 45 students having participated in the first two tests and not in any of the other four. It is a surprise that in these many years the number of students dropped-out immediately after the first semester is so small. Table 8 present the results of the analyses on the two separate tests. There is one difference with the analyses as reported in Table 6: now the expected marks are not corrected for under- or overestimation.
A fair comparison with the group of stayers is possible using the statistics in Table 9, the results of an analysis that is analogous to the one done for the drop-outs.
Comparing the means for the obtained marks, it is evident that the drop-outs score much lower. Nothing is said here about causal relations. The drop-out overestimate themselves, but the meaning of this is not at all evident from the data. The first test is difficult to predict, students do not yet know how they compare to the whole group of law students. It is quite possible that some students too hastily conclude that this study is too difficult for them. Remark that drop-outs have invested much less time than stayers, again a hint there are no simple causal relations here. Would they have invested as much time as their fellow students, their obtained marks might have been comparable to those of the stayers.
Table 8
Statistics for drop-outs after the two first tests
______________________________________________________________________________________________________
test/ mean standard      general introduction       constitutional law             vari-      deviation     -----------------------    --------------------
able                      1   2   3   4   5   6     1   2   3   4   5
__________________________________________________________________________________________________________________________________________
general introduction
 1   4.71    1.34
 2   5.88    0.73        39
 3  64      34           25  40
 4  63      29          -05  25  39
 5   0.399   0.113       22  61  87  61
 6   0.0130  0.0019     -05 -03 -68 -61 -46
constitutional law
 1   4.84    1.58        37  16 -12 -39 -14  31
 2   5.59    1.03        23  27  05  14  17  05   -01
 3  49      34           10  02  50  12  30 -39   -18  24
 4  46      22           02  39  35  81  52 -55   -23  21  08
 5   0.419   0.106       16  32  45  53  50 -45   -19  71  66  62
 6   0.0122  0.0021     -01 -31 -52 -75 -58  67    26  10 -36 -82 -54
_______________________________________________________________________________________________________
Note. See
Note Table 9.
Tabel 9
Comparable statistics for stayers after the first two tests
______________________________________________________________________________________________________________________________________________________________
test/ mean standard    general introduction      constitutional law
vari-      deviation   ----------------------    --------------------
able                     1   2   3   4   5   6     1   2   3   4   5
----------------------------------------------------------------------------
general introduction
 1   6.85    1.39
 2   6.27    0.80      34
 3  79      36         15  10
 4  82      25         18  12  17
 5   0.542   0.101     33  51  71  67
 6   0.0029  0.0005    06  58 -55 -37 -23
constitutional law
 1   6.68    1.47      49  34  23  18  36  01
 2   6.11    0.84      18  51  12  11  33  26    36
 3  63      32         15  14  63  26  57 -33    24  17
 4  59      19         08  11  19  79  56 -34    17  05  33
 5   0.556   0.122     20  33  53  57  76 -24    34  47  81  68
 6   0.0028  0.0005    05  25 -27 -41 -24  58    04  48 -53 -62 -40
______________________________________________________________________________________________________________________________________________________________
Note. 1 = obtained mark, 2 = expected mark (not corrected), 3 = hours of preparation for the test, 4 = hours preparing for and attending lectures and seminars, 5 = interest in obtained mark (interests in both time variables not tabulated), 6 = satisfaction; correlations are written without decimals.
Comparing the validities for the two groups, the correlations in bold print in Tables 8 and 9, it is evident that the validities for drop-outs are much lower. The reason might be that drop-outs as a group do not have a consistent pattern of studying. The exception is time spent in lectures and seminars, but these activities are spread over the whole first semester, while preparing for the test is concentrated in the weeks just before the tests, at the end of the semester.
The values obtained from the two-test system analysis and the two one-test system analyses are tabled for both drop-outs and stayers in Table 10. The results for the two-test system analyses are difficult to interpret because of the negative estimate for the one of the time variables. The one-test system analyses present a clear pattern. The higher amount of time that drop-outs choose to invest in extra-curricular activities should translate in higher values for time, as indeed it does as regards time spent in preparation for the tests.
Table 10
Values from system analyses: drop-outs compared to stayers
______________________________________________________________________________________________________________________________________________________________
group / system               values
                 ---------------------------------------
            time budgets
                                       ---------------------------
                             expected  preparation   lectures &
                              marks    for the test   seminars
______________________________________________________________________________________________________________________________________________________________
drop-outs (n=45)
-----------------
          two-test system       .678      .256         .066
          ------------------------------------------------------
          general introduction  .416      .397         .187
          constitutional law    .439      .294         .266
==================================================================
stayers  (n=179)
-----------------
          two-test system       .604      .555        -.159
          ------------------------------------------------------
          general introduction  .476      .265         .258
          constitutional law    .484      .249         .267
______________________________________________________________________________________________________________________________________________________________
Discussion
A unique set of empirical data on crucial student behaviours and test results in a major department of the university of Amsterdam is used with a recently by James Coleman (1990) presented social system theory to describe how students and teachers negotiate about marks and time expenditure. There are very significant relations between the empirical variables and the variables constructed on the basis of Coleman's theory. The analysis on the empirical variables, among them the mark expected by the student immediately before taking the test, makes it clear that students are very good in predicting their mastery of the domain the test is intended to measure. The tests themselves have poor validity, their quality leaves plenty of room for improvement. However, a counter argument might be that the examination allows compensation between the results for the six tests, thus lowering the relations between marks obtained on the several tests. The quality of the tests is a crucial factor in the educational system, because the test functions as a clearing house for the exchange between students and teachers. Students and teachers do not directly negotiate over time spent and the marks deserved, the negotiation is embodied in the test. (More about the test as clearing house: see the parallel paper, Wilbrink (1992)). If the student cannot be sure about the marks he will obtain, his interest in the sure yield of spending his time in extra-curricular activities might come to dominate his interest in obtaining favourable marks.
Does this kind of data analysis, using Coleman's social system theory, result in a meaningful connection of individual behaviour and the characteristics of the educational system?
Every policy maker interested in improvement of attrition, in higher motivation of students, or in better marks, must have insight into the ways in which the educational system influences individual behaviours en how the system itself in turn is shaped by collective individual behaviour. Especially government policies are directed at effects at the system level, in contemporary lingo called 'performance indicators.' Failure to evaluate the effects of education as obtained under the particular constraints of the educational system as traditionally is implemented will lead to failure of law-induced educational innovations.
Social system analysis using marks and time expenditure as data can expose the weaknesses of current methods of educational assessment. The social system analysis in the case of the Department of Law indicates there is plenty of room for improvement using modelling techniques for educational assessment as developed by Van Naerssen (1974) and Wilbrink (1978). Also in secondary education a social system analysis approach could point out the classical marking system as the main culprit in the case against (Dutch) retention rates of 15 to 25 percent every year. Remarkably, in English speaking countries there is an 'educational reform' movement in the direction of stricter grading policies, witness the publication of Shepard & Smith ( 1989) called 'Flunking grades.' This kind of reform moves in the direction of more sorrow for more students, and less efficiency at the system level. Time and again teachers, researchers and politicians have drawn attention to the darker sides of our habits in grading and marking, and to the damage that obviously is done. That there are no absolute grading standards in education is a public secret, not known to some teachers, policy makers and researchers. Where teachers use relative norms, educational innovations cannot possibly result in better examination results. The reverse may also be true: teachers using relative norms in the grading of students may loose control over the situation, resulting in study delay and attrition. So there is an awareness of the problematic nature of the marking and grading habits that dominate most of our educational systems, but there never has been even a beginning of understanding why it is that educational systems behave themselves in this way. The kind of analysis using Coleman's social system theory promises to be an important step in the direction of better understanding of systemic behaviours. The theoretical variables 'interests' and 'satisfaction' at the personal level, and values of educational resources at the system level, promise to be very useful is describing educational systems. Because Coleman's model is derived from micro-economic theory, this theory might be used to develop predictions about the effects particular changes in the system or in its environment might have on these personal and system characteristics. Two lines of research are especially important. The first is to unravel the factors that determine the relative interests students have in using their time either to study or in extra-curricular activities. The second line of research is to ascertain these extra-curricular activities, and their import for major educational objectives as well as for personal qualifications that determine the future labor market positions of the student (Wilbrink & Koppen, 1990).
Literature
Campbell, D.T., & Fiske, D.W. (1959). Convergent and discriminant validation by the multitrait-multimethod matrix. Psychological Bulletin, 56, 81-105.
Coleman, J. (1990). Foundations of social theory. Cambridge, Massachusetts: The Belknap Press of Harvard University Press.
Naerssen, R. F. van (1974). A mathematical model for the optimal use of criterion referenced tests. Nederlands Tijdschrift voor de Psychologie, 29, 431-445. pdf
Shepard, L. A., & Smith, M. L. (Editors) (1989). Flunking grades. Research and policies on retention. London: The Falmer Press.
Voorthuis, M., & B. Wilbrink, (1987). Studielast, rendement en functies propedeuse. Relatie tussen wetgeving, theorie en empirie. Deelrapport 2: Evaluatie-onderzoek Wet Twee-fasenstructuur. (theoretical part of the evaluation study of the 1982 Law on the two-tier system for university education) Amsterdam: Center for Educational Research.
Wilbrink, B. (1978). Studiestrategieën. Amsterdam: Center for Educational Research. html
Wilbrink, B. (1992). Modelling the connection between individual behaviour and macro-level outputs. Understanding grade retention, drop-out and study-delays as system rigidities. paper ECER, methodology section. html
Wilbrink, B., & Koppen, J.K. (1990). Employment prospects for graduates. Paper E-AIR Forum, Lyon. Amsterdam: Center for Educational Research. html
SUMMARY
(as submitted for inclusion in the ECER-proceedings)
Table 1 gives the values of marks for each of the six tests, in each of six years. The values of time simply are 1 minus the value of marks.
__________________________________________________________________________________________________________________________________________
  test      1983/4  1984/5  1985/6  1986/7  1987/8  1988/9
----------------------------------------------------------------
  1          0.36    0.39    0.40    0.38    0.40    0.38
  2          0.42    0.39    0.39    0.35    0.34    0.37
  3          0.43    0.43    0.46*   0.48*   0.51    0.48
  4          0.41    0.43    0.41    0.44    0.38    0.41*
  5          0.36    0.35    0.33    0.32    0.38    0.36
  6          0.37    0.30    0.27    0.27    0.31    0.26
----------------------------------------------------------------
examination: 0.40    0.39    0.38    0.38    0.39    0.38
__________________________________________________________________________________________________________________________________________
TABLE 1. The values of marks 1983/54 - 1988/9 for 6 tests, and the examination.
Notes: value of time spent = 1 - value of marks; N (students) = 109, 140, 88, 120, 106, 96 resp. over the years; only the students participating in all 6 tests; for three *-marked tests no questionnaires were received, the reported values were derived from estimations of the missing data.
Table 1 (part of it)
Relations between the empirical variables
__________________________________________________________________________________________________________________________________________
test/  m.  s.d.  general      constitutio-  private      history
                 introduction   nal law       law        of law
vari-            -----------  -----------  -----------  -----------
able              1   2   3    1   2   3    1   2   3    1   2   3
________________________________________________________________________________________________________________________________________
general introduction
 1   6.85  1.39
 2   6.27  0.80   34
 3 161    47      21  14
constitutional law
 1   6.68  1.47   49  34  27
 2   6.11  0.84   18  51  15   36
 3 121    42      15  16  72   26  15
private law
 1   6.45  1.53   43  37  14   54  32  24
 2   6.10  0.85   34  66  16   40  55  16   48
 3 126    46      10  18  70   18  14  75   25  18
history of law
 1   6.34  1.61   49  35  16   54  36  10   53  43  12
 2   5.92  0.82   23  53  21   29  38  18   30  58  18   45
 3  90    37      15  14  67   20  11  69   21  16  77   24  21
__________________________________________________________________________________________________________________________________
Note.
1 = mark obtained,
2 = mark expected,
3 = total of hours spent,
m. = mean, s.d. = standard deviation;
correlations are written without decimals.
Table 8
Statistics for drop-outs after the two first tests
____________________________________________________________________________________
test/ mean standard    general introduction     constitutional law
vari-      deviation   ----------------------   --------------------
able                     1   2   3   4   5   6    1   2   3   4   5
___________________________________________________________________________________
general introduction
 1   4.71    1.34
 2   5.88    0.73      39
 3  64      34         25  40
 4  63      29        -05  25  39
 5   0.399   0.113     22  61  87  61
 6   0.0130  0.0019   -05 -03 -68 -61 -46
constitutional law
 1   4.84    1.58      37  16 -12 -39 -14  31
 2   5.59    1.03      23  27  05  14  17  05   -01
 3  49      34         10  02  50  12  30 -39   -18  24
 4  46      22         02  39  35  81  52 -55   -23  21  08
 5   0.419   0.106     16  32  45  53  50 -45   -19  71  66  62
 6   0.0122  0.0021   -01 -31 -52 -75 -58  67    26  10 -36 -82 -54
____________________________________________________________________________________
Note. See
Note Table 9.
Tabel 9
Comparable statistics for stayers after the first two tests
____________________________________________________________________________________
test/ mean standard    general introduction      constitutional law
vari-      deviation   ----------------------    --------------------
able                     1   2   3   4   5   6     1   2   3   4   5
___________________________________________________________________________________
general introduction
 1   6.85    1.39
 2   6.27    0.80      34
 3  79      36         15  10
 4  82      25         18  12  17
 5   0.542   0.101     33  51  71  67
 6   0.0029  0.0005    06  58 -55 -37 -23
constitutional law
 1   6.68    1.47      49  34  23  18  36  01
 2   6.11    0.84      18  51  12  11  33  26    36
 3  63      32         15  14  63  26  57 -33    24  17
 4  59      19         08  11  19  79  56 -34    17  05  33
 5   0.556   0.122     20  33  53  57  76 -24    34  47  81  68
 6   0.0028  0.0005    05  25 -27 -41 -24  58    04  48 -53 -62 -40
____________________________________________________________________________________
Note. 1 = obtained mark, 2 = expected mark (not corrected), 3 = hours of preparation for the test, 4 = hours preparing for and attending lectures and seminars, 5 = interest in obtained mark (interests in both time variables not tabulated), 6 = satisfaction; correlations are written without decimals.
Ben Wilbrink
SCO-Kohnstamm Educational Research Center
Grote Bickersstraat 72
1013 KS Amsterdam
The Netherlands
tel. 020 5550363
To Mr. James D. Coleman
Amsterdam, May 17th 1994
Dear Mr. Coleman,
Your 1990 Foundations of Social Theory has proven to be a tremendous help in solving problems of interpretation that haunted me for years. In the 1980's I collected a highly interesting set of data consisting of grades obtained, grades expexted, en time spent by first year law students at the University of Amsterdam. Correlational studies of this kind of data typically lead to nonsense results, because of compensating mechanisms between these variables and exogeneous variables like intelligence and level of aspiration. Competition between students is also part of the problem.
I applied your model to these data, and reported this exercise in two papers at the European Conference on Educational Research in 1992. I'll use the papers in a (late-career) dissertation on educational assessment. It was my intention to send you the papers immediately after the conference ... Well, better late than never.
The results are quite spectacular, and definitely show that the social system theory constructs are valid descriptors of this particular educational setting.
Yours sincerely,
Ben Wilbrink.
THE UNIVERSITY OF CHICAGO
DEPARTMENT OF SOCIOLOGY
1126 EAST 59TH STREET
CHICAGO - ILLINOIS 60637
James S. Coleman
(312) 702-8696 - FAX: (312) 702-9529
E-mail: mill.kicero.spcmehicago.edu
June 1, 1994
Ben Wilbrink
SCO-Kohnstamm Educational Research Center
Grote Bickersstraat 72
1013 KS Amsterdam
The Netherlands
Dear Mr. Wilbrink:
Thanks very much for your papers. I read them with interest. I think you interpret the results quite well, and I thought the results are very instructive about the relative values of different areas of law in the Department of Law. The relative power of students and teachers (or the relative value of marks and time) for the overall system are less meaningful because (as in my example in the 1990 book), the true minimum for marks may not be 1, but something higher. The mark of 4 was the lowest average in your Figure 2.
I'm enclosing a paper I just finished using a different conceptualization of what goes on in school, though the same formal model, somewhat elaborated. Reading your papers, having just finished the one I'm enclosing, has led me to reflect upon whether the two processes (competition among students for achievement in various activities, and exchange with teachers) do in fact coexist, and if so, how the combination of these two processes can be modelled. I think one way of doing so is to assume that (to use the terminology of the new model) teachers award esteem only for the subject matter they teach, and that grades in a subject measure the achievement which is an argument in the student's utility function. The student, in maximizing utility (which in the new model is a Cobb-Douglas function of relative achievement in various activities) is both in competition with other students and in an exchange relation with all those who award him esteem for achievement in the same activity. Those persons, in turn, at least in the case of teachers, may be in competition with each other for the time of students. So I think a general equilibrium model could be specified, and with the right data, estimated.
If you have data on some measure of ability of students, you might be able to estimate such a model, by first estimating the coefficients in the production function for each subject (referring to the new model) instead of assuming them to be .5 as I have done in the paper, and assuming the ability measure is the potential in each subject, though with different coefficients in different subjects.
If you have any additional ideas about these things after reading the enclosed paper, I would be interested in hearing them.
Sincerely,
James S. Coleman
University Professor
JSC:dm
Work in this line of research stopped in 1992, regrettably. I have not yet looked seriously into the suggestion made by James Coleman in his letter.
However, there is a link to the SPA-model html, as indicated already in the 1992 papers. The pure SPA-model—Strategic Preparation for Achievement tests—is an individual model. Because individuals get treated as members of groups, they are necessarily involved also in situations of competition and/or negotiation. In one of the extensions of the SPA-model I will have to use the Coleman methodology in one form or another.
Datasets met zowel verwachte als behaalde cijfers komen niet zo vaak voor. Hierbeneden een artikel uit 2008, met vermoedelijk onjuiste analyses op geaggregeerde data (groepsgemiddelden). Dat is jammer. De dataset is beperkt tot cijfers voor één vak, wat de mogelijkheden voor interessante stellingen natuurlijk ook inperkt.
Christiaan Heij, Liesbeth Noordegraaf & Philip Hans Franses (2008). Stijgende verwachtingen, dalende cijfers. Tijdschrift voor Hoger Onderwijs, 28, 216-228.
Dan heb ik de volgende bijdrage van Entwistle & McClune (2001) belangwekkender gevonden, maar ik heb helaas niet aangetekend waarom precies. (druk, druk, druk)
Entwistle, N. J., & McCune, V. (2001). The disposition to understand for yourself: Learning strategies, effort and alertness to context in studying. In L-F. Zhang & R. J. Sternberg (Eds.), Perspectives on the nature of intellectual styles. Erlbaum.
Tyler M. Miller & Lisa Geraci (2011). Training metacognition in the classroom: the influence
of incentives and feedback on exam predictions. Metacognition and Learning, 6, 303-314.
Buzinski, S. G., Clark, J., Cohen, M., Buck, B., & Roberts, S. P. (2018). Insidious Assumptions. Teaching of Psychology, 45(4), 333–339. doi:10.1177/0098628318796919
url to share this paper:
sci-hub.tw/10.1177/0098628318796919
 http://www.benwilbrink.nl/publicaties/92ColemanApplicationECER.htm