Ben Wilbrink
SCO-Kohnstamm Institute for Educational Research
University of Amsterdam
Time on task is a major determinant of achievement. There are large differences between students in the amount of time they invest in preparation for tests. Typically these differences in preparation time show only weak correlations with achievement, indicating that individual students have their own reasons for choosing to spend their time in preparation for this or that test, or elsewhere. Individual choice in preparation time can be modelled, allowing for the stochastic character of the particular assessment instrument(s) involved. The stochastic part of the model makes use of statistical theory, not of psychometrics, to evaluate the expected returns to the alternative uses of his time that the student must choose between. The choice situation is depicted in the standard micro-economic format of indifference curves. Predictability of test scores is a crucial part of the assessment model; i.e. prediction by the testee, not by the tester. The entire model is implemented in a computer program. It is possible to vary crucial parameters of assessment situations and study the way how that influences the strategic choices students have in optimizing their investments of time. Not only is this program a research instrument, it can also be used by teaching staff to study the effects possibles changes in the assessment program might have on the behavior of students, thereby clearing inefficiencies out of the way.
Time on task is a major determinant of achievement. There are large differences between students in the amount of time they invest in preparation for tests and examinations. Typically these differences in preparation time show only weak correlations with achievement, indicating that individual students have their own reasons for choosing to spend their time in preparation for this or that test, or elsewhere. On the aggregate level data can be analysed using Coleman's (1990) social theory. Coleman (p. 136) presents an instructive example using data from his study High school and beyond; Wilbrink (1992) used Coleman's theory with time and achievement data of law students. The problem with analyses on the aggregate level, or with Coleman's theory, is that the test itself is treated as a black box. In reality, of course, every test is probabilistic, no student being sure about the score or grade that his or her investment in preparion time will deliver. Decision theory (Hirshleifer & Riley, 1992) teaches us that insecurities involved in lotteries of all kinds (examinations included, see Edgeworth, 1988, p. 626), influence the choices that people make or should make.
Individual choice in preparation time can be modelled, allowing for the stochastic character of the particular assessment instrument(s) involved. The stochastic part of the model makes use of statistical theory, not of psychometrics, to evaluate the expected returns to the alternative uses of his time that the student must choose between.
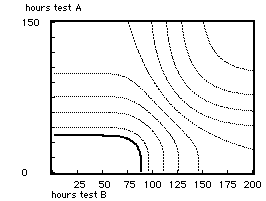
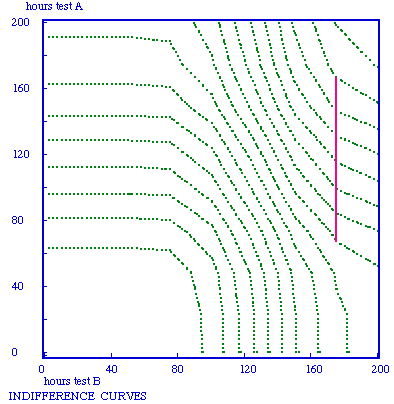
This model of choice behavior is highly specific to assessment in education, especially in continental European higher education where there is more leeway for individual choice in how one spends her or his time (Schouwenburg, 1993). Even though the model is specific to choices in preparation time for tests and examinations, ultimately the choice situation is depicted in the standard micro-economic format of indifference curves. The figure above illustrates indifference curves involved in the problem how to distribute one's time between the preparation for test A and test B, both tests to be taken on the same day. The many parameters involved in this plot, including utility functions over scores on test A and B respectively, will not all be explained in this summary.
Predictability of test scores is a crucial part of the assessment model; i.e. prediction by the testee, not by the tester. In a sense the model is an operationalisation of the concept of transparency (De Groot, 1970). The information the student uses for her or his prediction is the score on a parallel test form, a preliminary, to be taken some time before the to be predicted assessment. There does not need to be a real preliminary: the information the student has on her or his mastery can always be expressed in a somewhat Bayesian way as equivalent to a certain score on a preliminary with a particular number of items. Using the principle of maximum likelihood and simulation techniques, a prediction can be obtained in the form of a frequency distribution on the test. No distributional assumptions whatsoever are involved here. This static model is graduated into a dynamic model by including a simple but robust learning model, making it possible to predict results conditional on extra investment of study time. To make it a truly decision-theoretic model, a utility function is to specified on the test score dimension. Latent traits or true scores are of no interest here, because educational decisions about individual students are made on the basis of obtained scores. Some misconceptions of the utility concept, to be found in the educational measurement literature, will be cleared at this point. Applied to one particular test, the model will not give an indication of what is the optimum investment of preparation time. Applied to two tests, as depicted in the figure, there are definite optimum levels in the way preparation time is divided up between the two tests (take the point where a particular curve touches the 135 degree line; this division of time is the miminum total amount of time that delivers the particular expected utility represented by that difference curve). The same might be done by pitting preparation time for a test against the alternative of free time (or time spent in extra-curricular activities).
The entire model is implemented in a computer program. It is possible to vary crucial parameters of assessment situations and study the way how that influences the strategic choices students have in optimizing their investments of time. Not only is this program a research instrument, it can also be used by teaching staff to study the effects possibles changes in the assessment program might have on the behavior of students, including procrastination, shift of grading norms, importance of test length and of authentic testing (as against test secrecy, see Wiggins 1994). In fact the program consists of two parallel programs: the first is based on the use of a random number generator to simulate the prediction and decision situation, while the second one uses statistical distribution functions. The two parts are independent of each other, but of course the mathematical model can be approached by choosing a high enough number of simulation runs. Model-building by simulation makes it easy to explain the model to students and to teaching staff; the mathematics will not come in the way. Of course, the simulations take more computer time, so the mathematics comes in handy when more complex situaties and longer tests are to be analysed. The magic of the mathematics is the reduction in computer time that it makes possible. The mathematics involved, binomial and betabinomial models (van den Brink, 1982; Verhey, 1993), has no surplus explanatory power whatsoever.
There are many inefficiencies in curricular and assessment programs because of repetition of tests, retention, or procrastination. Application of the model will suggest why it is efficient for the students to behave the way they do. This insight will show the way how to make it efficient for them to behave otherwise.
Brink, W. P. van den (1982). Binomiale modellen in de testleer. [Binomial models in educational measurement] Dissertation, University of Amsterdam. In Dutch.
Coleman, J. S. (1990). Foundations of social theory. London: The Belknap Press.
Edgeworth, F.V. (1888). The statistics of examinations. Journal of the Royal Statistical Society, 51, 599-635.
Groot, A. D. de (1970). Some badly needed non-statistical concepts in applied psychometrics. Nederlands Tijdschrift voor de Psychologie, 25, 360-376.
Hirshleifer, J., & Rley, J. G. (1992). The analytics of uncertainty and information. Cambridge: Cambridge University Press.
Schouwenburg, Harry (1993): Uitstelgedrag bij studenten. [Procrastination at the university] Dissertation, University of Groningen. In Dutch.
Verheij, J. G. C. (1992). Measuring utility, a psychometric approach. Dissertation, University of Amsterdam.
Wiggins, G. (1994). The immorality of test security. Educational Policy, 8, 157-182.
Wilbrink, B. (1992). The first year examination as negotiation; an application of Coleman's social system theory to law education data. In Plomp, Tj., Pieters, J. M., & Feteris, A. Book of summaries; European Conference on Educational Research. Enschede: University of Twente. pp. 1149-1152. html
6th European Conference for Research on Learning and Instruction, Nijmegen. Abstract + Summary + Paper
Ben Wilbrink
SCO-Kohnstamm Institute for Educational Research
University of Amsterdam
Student achievement depends on the
quality of preparation and on 'time on task.'
Students do have some degrees of freedom in the
allocation of their time.
Faculty can influence the students' allocation of time by
changing the characteristics of the assessment procedure.
Making the above notions precise results in an assessment model that faculty may use to optimize educational effectiveness.
Students, like other human beings, have certain degrees of freedom in the spending of their daily available 24 hours, part of those hours being spent in attending classes and studying, another part being spent on a host of other attractive or necessary activities and on sleep; the way the student allocates time to studying or to extracurricular activities surely depends on personal preferences, but also on the quality of the curriculum that is offered, and in particular on the quality of the assessments that go into the final examinations. The student is particularly interested in the marks to be earned for final exams, grade pont average, or whatever marking system is used. Faculty members are aware of this attitude of their students, and tend to blame low marks on a lack of motivation on the part of the student. Regret it or not, marks do play a an importat part in the life of every student, but like any consumer they have to decide whether to 'buy' higher marks by invetsing more time in preparation, or to use this time for alternative goals: the choices of students in allocating their time are consumer choices.
There is not the least of doubt that investing more time in the preparation for important tests will result in higher marks, or more precisely: in a higher expected or predicted mark. The same relationship exists between the quality of the invested study time and the expected mark. Yet it is a common observation in education that students do not invest every spare minute they can muster in the preparation on examinations. That observation implies that there is a trade-off for the student between spending yet another hour or day or week on the pending examination, and spending that time playing soccer or dating the boy or girl next door. Now the hunch is that certain qualities of the test, and of the way marks on different tests are combined to result in the final examanition outcome, may influence these decisions of students. For example, if the test resembles more an intelligence test than an achievement test, that certainly is not an incentive to for students to invest extra time in preparation. Another example is the very short test, presenting the students more of a gamble than a real test, compared with the test that adequately samples the knowledge and skills in the objectives of the curriculum.
It is possible to make the above notions precise in the form of a model or theory, even in a model that does not depend on psychometric theory, and that is implemented in a computer simulation program that may serve as an instrument in the hands of faculty and educational managers. This instrumental quality means that the model is of the prescriptive type: it prescribes good practice or what the characteristics of the test and the examination rules must be in order to reach results that are optimal in a pre-specified sense. This kind of model was suggested by Bob van Naerssen (1974), using a decision-theoretic framework instead of the usual educational measurement one (the theory is presented in Wilbrink, 1995). An alternative approach would be to develop a descriptive model, a model that also describes the competitive relations between students confronted with tests missing absolute norms; I have developed this descriptive model elsewhere (1992), using the general theory of social systems as developed by Coleman (1990).
The model uses concepts that are understandable
to faculty from any discipline.
It is possible to implement the model on the computer as an instrument to investigate the interplay between the characteristics of the assessment procedure and what are optimal strategies for the student in preparation for assessment.
Any assessment model that is to be used by faculty must be understandable to faculty. The teacher is responsible of his or her decisions regarding this or that student, it follows that the teacher must be able to explain the procedures followed in the construction of tests and the marking of tests. In the Netherlands, where students have the possibility to enter an appeal against assessments, the teacher must be able to explain procedures in court, so assessment models that suppose expertness in educational measurement will not do for use with teacher-made test and faculty-made examinations. The assessment model here to be presented will not use any statistical or mathematical concept that presupposes specific training. Nevertheless, the model can be translated into a mathematical model, having the advantage of speed of calculation, and linkage to known statistical models (such as the binomial testmodel).
Because the model involves rather complex relations between motivation, learning, and testing, a computer implementation was developed to be able to picture these relations in the form of graphical output, and also to picture changes in results when one or more characteristics of the student, the test or the test situation are changed. It is inherent in the nature of tests that they are samples from domains of conceivable test questions; the model uses sampling from the domain of questions, in the computer model this is done by using pseudo-random numbers, i.e. a 'computerized die.' Thus the computerized model simulates assessment situations, and by choosing the the number of runs in the simulation large enough highly regular results will be obtained.
Explaining the model is almost the same as explaining the use of the computer application, and proceeds stepwise from the basic notion of sampling from a domain until the indifference function that compares the expected utility of two behavioral alternatives, every step having its own graphical representation. The link with the mathematical model that also is implemented in the computer program is a simple one: the results of the mathematical model look like the results of the simulation model when the number of runs is chosen very large. Of course, the mathematical model needs but a fraction of the computer time that is needed for a simulation with a large number of runs.
Indeed, the perspective of the student is the point of departure.
A decision making frame of reference is chosen:
the decisions of the student in allocating time.
The model is a model for one student only,
it does not compare students.
In the model the perspective of the individual student is chosen, not that of the teacher or examinator. This choice, first made by Van Naerssen, has vast implications, being a shift in the conception of assessment, away from the physical concept of measurement of achievement, towards a functional concept of shaping the assessment conditions in such a way that specified results are realized. The role of faculty in this plot is the subject of the next section. The individual perspective is the situation the student sees him or herself confronted with: the three tests set for this week, and the many other activities planned and as yet unplanned for this week. The student permanently makes desisions about the allocation of scarce time to this or rather to that activity; this decision making can be formalized, using economic decision theory (Keeney & Raiffa 1976). Only some very basic concepts are used in the model, not putting serious strains on the lay user who never has heard of decision theory yet has practiced it unknowingly. The basic principle is that out of two actions with different expected payoff the one with the highest payoff will be chosen by the rational decision maker. If the expected payoff of an extra investment in the preparation for the test in psychology is higher than that in preparation for the test in statistics, statistics loses.
The decision making of only one student is sufficient for the model, for all possible variations in the case of one student are equivalent to all possible variations to be found in groups of students. It is up to the user of the model to investigate and analyse variations that are likely to occur in particular groups of participants in this or that course. The choice for the one-student-model is not a principal one, it simply is not necessary to complicate matters by simultaneously modeling students with possibly different characteristics. An objection could be made that in this way competitive relations between students fall out of the model; that is true, in a way, but the individual student, having knowledge of the strategies of fellow students, may simply accommodate these in his or her strategy, thus staying within the model. In general, many characteristics of the assessment situation, such as its competitiveness, find expression in one or another characteristic (= parameter) of the model.
Influencing the optimal strategies available to students
is the only chance faculty have to optimize educational results,
as far as assessment is concerned.
Changing the characteristics of the assessment procedures
will do the trick.
The model and computer program are instrumental in finding the promising directions of change.
In assessment teachers as well as students are involved; while students are the basic decision makers in allocating their own time, on a higher level faculty have to decide on the very characteristics of their assessment procedures that influence strategic student behaviour. The 'higher level' means that faculty rational decision making should reckon with strategic behaviour of students, in other words, faculty should accept that given a particular assessment situation the best strategies of students will have a particular form independent of faculty's wishful thinking on student behaviour. Then the next step is to exploit this behavioural law, and seek to change the assessment situation in directions that make students change their strategies in directions preferred by faculty. It really is not so complex as it seems, but it is slightly more complex than straightforward rule-governed behavior; think of a firm that uses its knowledge of consumer preferences and behavior to better style its productline in order to enlarge its market share.
In this approach the design of assessment situations is a problem in behavioural science, not in psychometrics. In the social sciences the men and women that are the subjects of research do not behave like the inanimate objects in the physical sciences: people have expectations, they talk back, they interprete what they think that are the intentions of the researcher, therapist, teacher or tester (Hofstee, 1981). In education the objectives are even explicitly formulated in terms of final assesments that the curriculum is the preparation for. Educators and politicians have always known that examinations have strong influences on the behavior of students as well as teachers, be it for good or for evil; in the literature these effects are called the backwash of assessment (Darling-Hammond 1994:8, for an example).
This reversal in testing from measurement to 'motivation' does not imply that certifying or final examinations, for example, become less serious: to the contrary, their seriousness is one of the key characteristics that carefully have to be monitored. The traditonal approach to examinations is a problem here, being one of control, of authorities wanting to be sure that minimal standards have been realized, etc.; there is nothing objectionable in such an approach, however, unless the attention of the examinators is exclusively fixed on the control function to the neglect of negative backwash effects. The model makes it possible to control the backwash, in the process making the curriculum more effective, and in the end to realize higher levels of achievement, or the same levels of achievement in less time, or to reduce the number of failing grades.
Back to the perspective of the student: for him or her it is important to pass the examination, or to get at least a particular mark, and not whether something like his or her 'true' mastery is above a pre-specified level. For faculty what is important is the pass-fail rate, not the Platonic numbers of 'false' decisions made. Faculty should watch out for the strategies students use to obtain the desired results, and how these strategies may change by changing certain characteristics in the assessment situation, such as secrecy of scoring and tests (treated in the next section).
To enable faculty to embark on this meta-strategy of influencing student strategies, they need a model of their assessment situation and of the changes that can be made in the assessment situation, that model, of course, incorporating the strategies that are available to students. The next sections treat the many ingredients that have found a place in the model, such as characteristics of tests, interests of students, predictability of test results, a model of learning, and techniques to pitch decision alternatives against each other. The computer instrument makes it possible to vary one or more characteristics of a specific situation, and immediately picture its consequences in terms of optimal strategies that are available to students.
The student must be able to predict test results,
otherwise his or her optimal strategy is to do nothing.
Predictability alone is not enough:
an intelligence test may be predictable, but the student cannot prepare herself otherwise than by sleeping well.
Educational tests must be transparent to the students,
there must be no secrecy.
The model is an operationalizaton of the concept of transparency.
The score on a preliminary test is the basis for predictions.
Evidently, for students to have strategic choices in the investment of their time in the preparation on test A, they must have at least a vague idea about the contribution this extra investment makes to their expected results on test A. If they have no idea at all, for example because test A is an intelligence test, their best strategy is not to invest any time at all. Now the result on an intelligence test may be predictable, but there is no way that one can prepare oneself for the test by studying or training: an intellence test is not transparent. Transparency is a broader concept than predictability, and it is an important quality characteristic of assessment (and not of intelligence tests, of course). A stronger statement is that transparency is a major quality characteristic of assessment: De Groot (1970) introduced the concept as an essential characteristic of educational assessment, next to reliability and validity; hopefully the anticipated APA Standards for the 1990s will adopt this concept (Shepard, 1993), or at least condemn secrecy in assessment tests (Wiggins, 1993, 1994).
To avoid any misunderstanding: the model has nothing to do with coaching strategies like those of John Katzman's Princeton Review (f.e. Martz, Katzman & Robinso, 1994), or working through the published tests of, for example, the SAT (The College Board, 1988). Another possible misunderstanding lies in the concept of predictability; in the literature predictability typically is studied from the perspective of the test user, while here predictability by the test taker is the issue.
To get a handle on the predictability/transparency of the test result for a particular student, a measure is needed for the information the student has about her present mastery level and learning capacity. To this end the concept of the score on a preliminary test is used, i.e. a test that in all relevant characteristics is parallel to the test to be taken. The preliminary is drawn from the same domain of test questions that the test will sampled from, but need not have the same number of items. In a next section this will be made precise; here the point is that the score on the preliminary can serve as the operationalization of what is meant by the information the student has to base her prediction on. If in a particular assessment situation it is not possible to construct a preliminary test, than that situation surely is not transparent, and there are no rational strategies for the serious student to prepare for the test.
Prediction of test scores involves many chance elements,
making it difficult to grasp.
This complexity can be eliminated by simulation of the chance elements.
From the perspective of the student every test looks like a
random sample from the domain of relevant items.
This observation is the point of departure for the simulations.
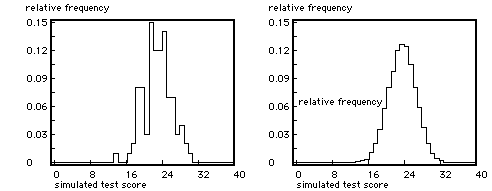
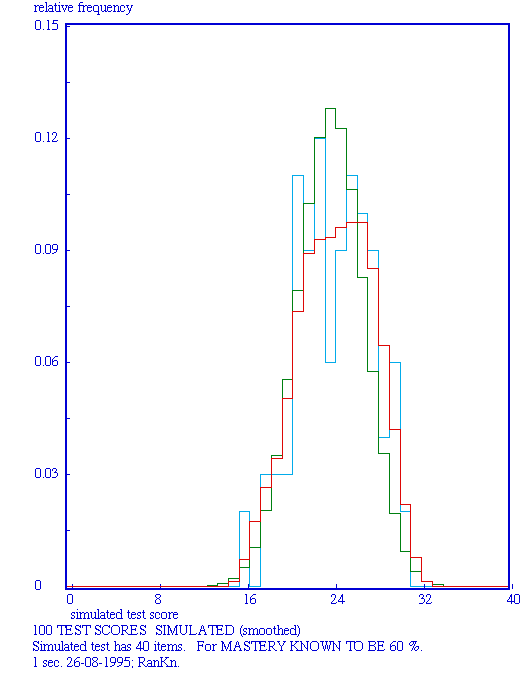
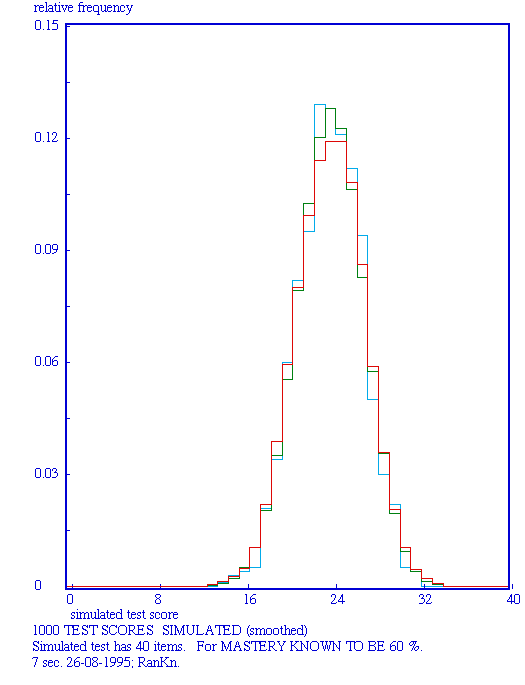
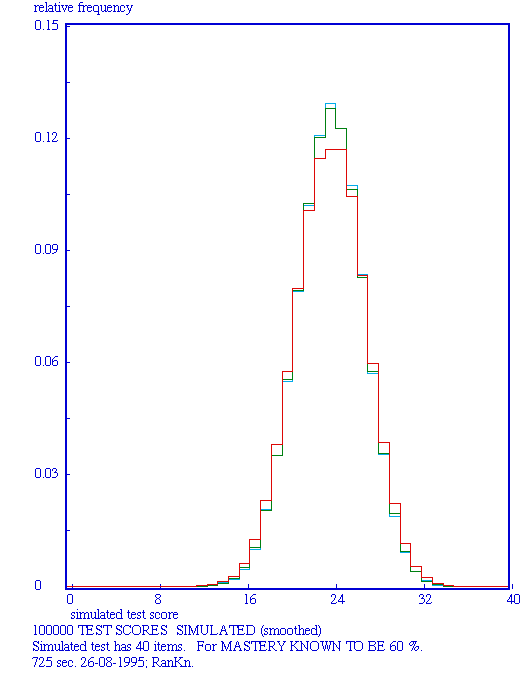
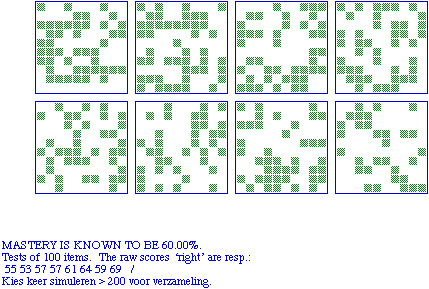
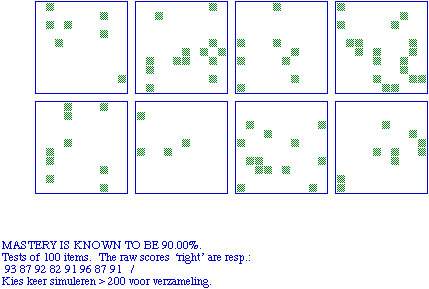
Every test is only a sample from some domain of knowledge or skills, so there are chance elements involved in every test. Probability isn't a difficult concept, after all everybody has to deal with many probabilities in daily life, but it is the theory of probability that is difficult. Luckily, the computer can be used here as a workhorse that simulates the chances involved in taking tests. The basic process is to generate item scores using a presupposed mastery level. In this way as many testscores can be generated as one likes in order to get a regular score distribution (see the Figures for examples), that score distribution being the prediction for a student that happens to know her mastery. The Figures below give examples of the output of the computer instrument, also serving as illustrations going with the text.
Mastery is defined on the domain of questions that the test will be a sample of as the proportions of items that would be answered correctly. There need not be a concrete set of items, it is only the idea of such a set that is needed here. There are situations where a collection of items is available, than that is fine. In France in de mid-nineteenth century a set of 500 items was used: the final examinations in secondary educations were sampled from this set of 500 by drawing lots (Prost, 1968:68); no wonder there were serious backwash effects of this procedure, yet it was probably the first time the curriculum was determined by the examination instead of the other way round.
The construction of the test need not be by any sampling procedure: how faculty go about their construction task is not important; after all, from the perspective of the student, every test looks like a random sample and that is the relevant fact for prediction of the results on the test. Even if the test is constructed using arcane item response theory, that makes no difference from the student perspective. Indeed, this suggests the possibility that the last theory, and psychometrics in general, is irrelevant to educational practice so might do more harm than good.
The score on a preliminary test contains information on
the mastery level of the student.
That information may be used to derive a
personal prediction for the test result.
Using a learning model,
predictions reckon with yet to be invested preparation time.
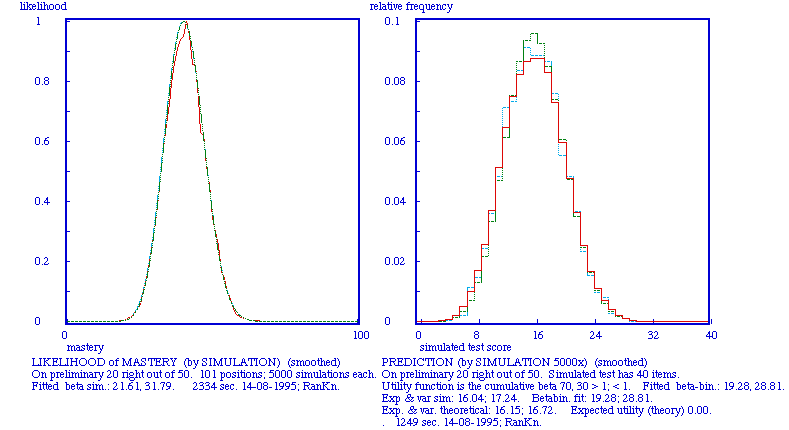
No student ever knows her (real) mastery level, neither do faculty; yet it is possible to derive predictions from the fallible information that is available. The score on the test gives an indication, that indication being better the longer the test, and so does the score on a preliminary test. The question then is precisely how the last score enables one to assert something about the probability of this or that mastery level being the 'true' one. Using the preliminary score it is possible for every contemplated level of mastery to determine the relative likelihood of this particular score; the technique used is the same as the simulation treated in the last section, making it possible to determine the proportion of simulated scores that are equal to the score on the preliminary. Doing this for a series of possible mastery levels results in a function of this likelihood, the maximum of this function is then arbitrarily fixed at one because this function is not a statistical density function. Bij repeatedly sampling a mastery level from this likelihood function, and generating a testscore, the prediction of the testsscore is derived. No distributional assumptions are needed here, for those who care to know, however, the theoretical equivalent is the beta-binomial model. This beautiful simulation technique makes it possible for the student to determine whether her mastery is on a satisfactory level, that is whether the chances are good enough to realize a reasonable score on the coming test. Again, on a higher level, faculty may use this technique to make it clear for themselves whether the predictability of the test is better or warse than the intuitive idea they have about it.
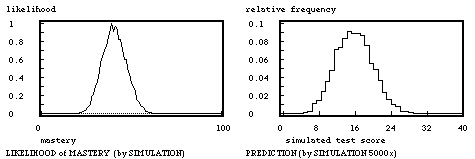
Note. The score on the preliminary test is 20 out of 50.
In practice more information might be available than only the preliminary score; that extra information may be incorporated in the model by translating it into a pseudo-score on a pseudo-preliminary that is equivalent in informational value. The results on two or more (pseudo) preliminaries may be combined by simply adding scores as well as testlengths so as to result in a combined score on a combined preliminary. Remark that this concept of a preliminary allows incorporating in the model specification any information on one's mastery level, of whatever character that information may be.
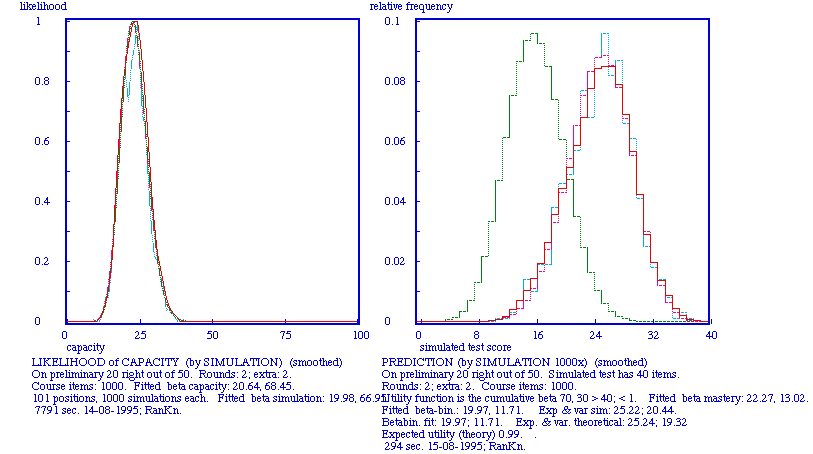
The model as specified thus far is static, allowing only decisions to yes-or-no invest more preparation time for the test, and not how much more time: for the last purpose a learning model is incorporated making the model a dynamic one. The specific nature of the learning model is not critical, because most uses that are made of the model lie in the sphere of balancing several options in test-preparation against each other, thus making it possible for a misspecification of the learning model to cancel itself by the left and right balancing act. So a simple model is preferred above a more complex one, and certainly a simple model is the following. Suppose going through the learning material (called a 'study round' in the figures) costs as much hours or days the first time as any later time, and suppose that every time the same fraction is learned of the 'items' in the material that were not yet known. Using this learning model and the same kind of simulation technique as in the case of the likelihood of mastery, it is possible to determine the likelihood of the learning capacity, being the fraction of the learning material that the student learned in a study round. Picking at random values from the likelihood of the learning capacity, and then simulating the learning process, using the resulting mastery level to generate a test score, a prediction for test scores is generated for a particular number of study rounds. Now it is possible to predict what the testscore will be after investing extra preparation time. This may all seem pretty complex, and yes it is; the real question is whether this model is more complex than what students must do intuitively when deciding to go to the movies or to invest the evening hours in extra preparation for tomorrow's test.
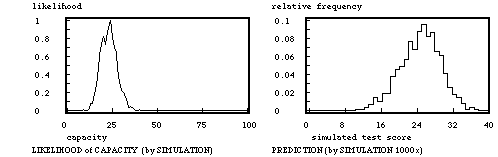
Note. On the preliminary the score was 20 right out of 50 items. The subject matter then was studied twice; on that information the likelihood for learning capacity is determined. The prediction is for the situation that obtains when the subject matter is studied another two times, totaling 4 times.
The mean of the scores is not always a
good indicator to base decisions on.
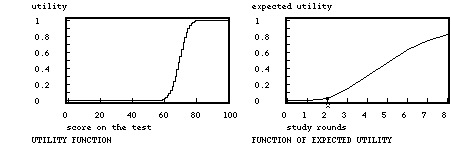
A utility function on obtained scores can be specified, this being a personal 'correction' on the objective scale of scores.
Weighting the predictive score distribution with the utility function results in the expected utility.
Expected utility is what counts in decision making, the rational actor preferring the action giving the higher expected utility.
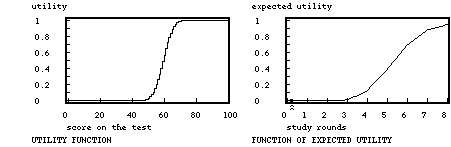
Predictions of testscores in the form of score distributions are too detailed to be of much use; a reduction of all that information to one number would be nice: the mean score, for example, or better yet the expected utility making use of the concept of utility that will be introduced here. Predictions in the form of score distributions are too unwieldy to be of much practical value, so it is tempting to use the mean of the distribution as the ground to base decisions on. However, there are circumstances where the mean is not an apt measure, for example where pass-fail grading is used, and in the general case where the student is risk-aversive for the higher scores, and risk-seeking for the lower ones. A useful analogy is with with money: for smaller amounts of money people are risk-seeking, furnishing bookmakers a living, while for greater amounts of money where people are risk-aversive and willing to pay insurance premiums instead of taking the risks. In assessment a good score is highly preferred, and still better scores only slightly more. In the case of grade point average systems a 'neutral' utility function is a linear function, every point extra being valued equally, no matter where the pint is scored. A personal utility function is then an ogive-like function, at the lower end lying under the neutral one, at the higher end above it. In the case of pass-fail grading there is no room for personal preference: the utility function being 0 below the cutting score, and 1 when equal to or greater than it. The utility function is a powerful means to get grip on those situations where numerical values of scores or marks do not capture their value to the student or to faculty. Remark that utility functions must be specified on obtained scores, not on any underlying dimension of 'true mastery' as happens in literature where the perspective of the scientific researcher is the starting point of the model; in education the obtained scores are decisive in credentialing, promotion, or admission, how fallible they may be (and most of the time are).
The utility function is merely a necessary step to be able to substitute the expected utility for the mean of the predicted score distribution, the former being the mean of the predicted scores weighted by their utility. Now for every prediction its expected utility may be determined; when this is done for points on the learning trajectory, a function of expected utilities is obtained that immediately shows where in the learning trajectory an hour of study contributes the greatest rise in expected utility.
Note. The function of the expected utility is by simulation derived from the likelihood of capacity; the number of items in the test is 40, the score on the preliminary test was 20 out of 50.
The model makes it possible to compare the expected utility of extra investments of study time in course A versus B.
The teacher of course A might have an edge over his colleague, in that extra investment of an hour of study time pays off better in course A than in course B.
Strategic choices available to students can be depicted using indifferences curves,
thus connecting assessment theory to micro-economic theory.
In an intuitive way the function of expected utility may reveal what good strategies are, but for the optimal allocation of her time the student also needs the expected utility of alternative uses of time, and a method to find the said optimum; in this paper the preparation for another test to be done on the same day is chosen as the alternative. The first step is to derive the function of expected utility for the alternative test. Now the two plots of expected utilities against preparation time do not reveal easily what optimal allocations of time are. The first question the student has to answer is 'What level of total expected utility do I want?' If for both tests utility is scaled from zero to one the maximum of their sum is two, and the student could specify 1.8, for example, as the preferred level of expected utility. Now there are many possible combinations of preparation time for test A and B that result in this summed expected utility of 1.8, hopefully only one combination giving a minimum of total preparation time. There is a more systematic way to do this number crunching, by plotting what economists call indifference curves; for the example a curve may be plotted through all the points of combined preparation time for test A (vertical axis) and B (horizontal axis) that result in the total expected utility 1.8, and in the same plot also the curves for 1.6, 1.4 etc. may be depicted. Optimal strategies can be found using straight lines of minus 145 degrees that connect pints of equal value on the axes: pints of contact on tangent lines are the points of optimal strategy, connecting these points results in a trajectory of optimal startegies, known as the Engel curve.
Note. The function of the expected utility is by simulation derived from the likelihood of capacity; the number of items in the test is 100, the score on the preliminary test was 60 out of 200.
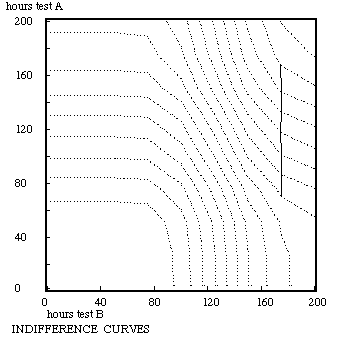
Note. Test A is the test that was depicted in section 8, test B in section 9. The gray curves are lines of equal summed expected utility, the value being higher the further removed from the origin. The line is the Engel curve, connecting the points of optimal strategy. Preparation for test B should be given high priority by the rational student. The teacher of course A evidently has a problem.
Now the testmodel has been developed up to and including the point where economists can take over, using standard micro-economic paradigms. The computer implementation is an instrument that faculty can use to study variants in testing situations, especially variants in transparancy, and the effects they may have on what students see as their optimal strategies in preparing for examinations. Needless to say, the model only suggests what optimal strategies are, empirical data must be collected to test that suggestion. It needs to be stressed that the model is prescriptive, making use of sophisticated though transparent techniques, and as such does not have the pretention that it also describes how students allocate their time. No doubt students use a lot of 'satisficing' decision strategies that result in more or less sub-optimal results. Then the slightly alarming conclusion must be that the model, how disappointing its results in terms of predictability of educational outcomes already may be, presents too optimistic a picture of that predictability. In terms of student well-being the implication is that assessment of student achievement in high stakes situations probably is much less fair than faculty and even students themselves think it to be, hinting at the possibility that the quality of assessment at the present stage probably resembles that of simple physical measurements in the late middle ages (Kula, 1986).
Coleman, J. S. (1990). Foundations of social theory. London: The Belknap Press.
College Board, The (19883). 10 SAT's, plus advice from The College Board how to prepare for them. New York: College Entrance Examination Board.
Darling-Hammond, L. (1994). Performance-based asessment and educational equity. Harvard Educational Review, 64, 5-30.
Hofstee, W. K. B. (1981). Psychologische uitspraken over personen. Beoordeling, voorspelling, advies, test. Deventer: Van Loghum Slaterus. [Psychological statements about people; assessment, prediction, advce, test]
Keeney, R. L., & Raiffa, H. (1976). Decisions with multiple objectives: preferences and value tradeoffs. New York: Wiley.
Kula, W. (1986). Measures and men. Princeton, New Jersey: Princeton University Press.
Martz, G., Katman, J., & Robinson, A. (1993). Cracking the GMAT, with diagnostic tests on disk. Proven techniques from the country's test-preparation course. New York: Villard Books.
Naerssen, R. F. van (1974). A mathematical model for the optimal use of criterion referenced tests. Nederlands Tijdschrift voor de psycologie, 29, 431-446. pdf
Prost, A. (1968). Histoire de l'enseignement en France, 1800-1967. Paris.
Shepard, L. A. (1993). Evaluating test validity. In Darling Hammond, L. Review of research in education, 19, 405-450.
Wiggins, G. P. (1993). Assessing student performance. Exploring the purpose and limits of testing. San Francisco: Jossey-Bass.
Wiggins, G. (1994). The immorality of test security. Educational Policy, 8, 157-182.
Wilbrink, B. (1992). The first year examination as negotiation; an application of Coleman's social system theory to law education data. In Plomp, Tj., Pieters, J. M., & Feteris, A. Book of summaries; European Conference on Educational Research. Enschede: University of Twente. pp. 1149-1152. html
Wilbrink, B. (1995). Van Naerssen's tentamenmodel in algemene vorm. In B. Creemers e.a. (1995). Onderwijsonderzoek in Nederland en Vlaanderen 1995. Proceedings van de Onderwijs Research Dagen 1995 te Groningen. Groningen: GION. 114-115. Paper: auteur. html
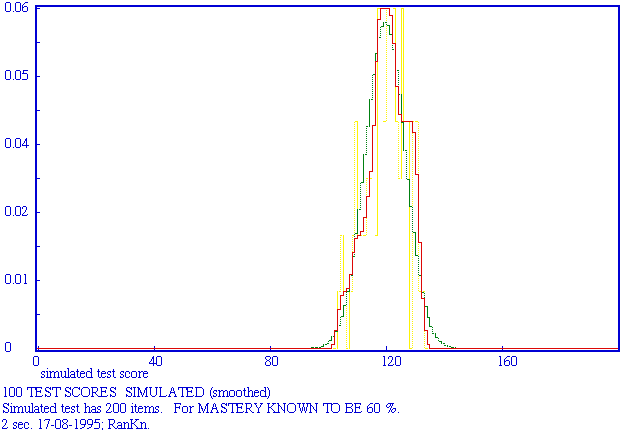
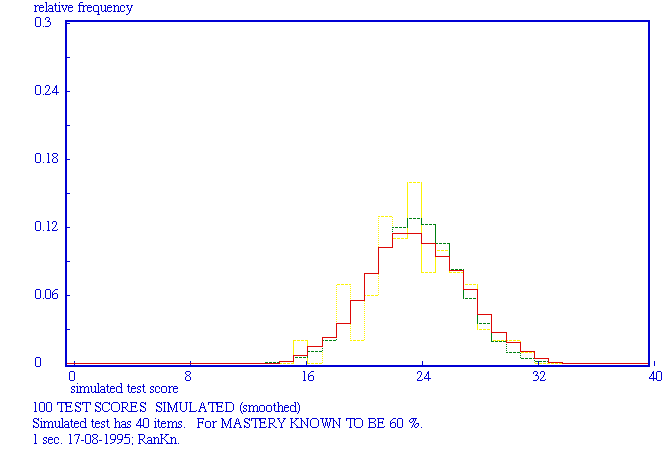
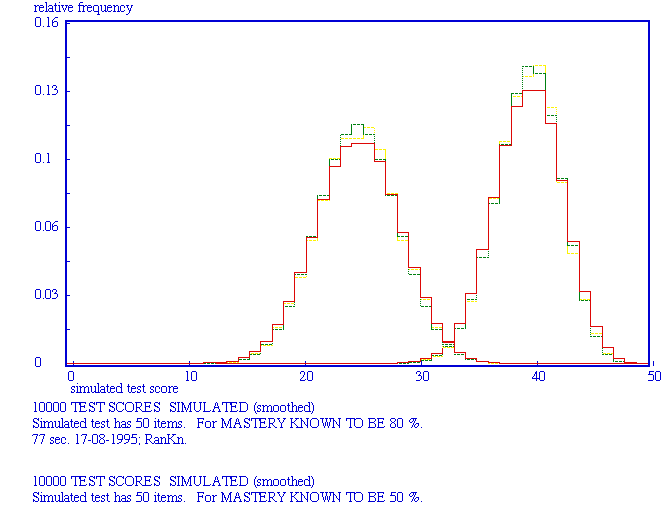
Left: known mastery = 50%; right mastery = 80 %. Cyan: simulated curve; red: smoothed curve; green: theoretical curve.
On preliminary 20 right out of 50. Cyan: simulated curve; red: smoothed curve; green: theoretical curve.
On preliminary 20 right out of 50, at that moment 2 study rounds done.
Cyan: simulated curve; red: smoothed curve; green: theoretical curve.
In the prediction: the green curve is the theoretical prediction should the test be done immediately after the preliminary; the prediction is for 2 extra study rounds.
The utility function is a fairly steep one. The fuction of expected utility is based on simulations (1000x), taking a simulated likelihood for capacity as its basis, the last one being based on a preliminary score of 20 right out of 50.
Note. Test A is the test that was depicted in section 8, test B in section 9. The gray curves are lines of equal summed expected utility, the value being higher the further removed from the origin. The line is the Engel curve, connecting the points of optimal strategy. Preparation for test B should be given high priority by the rational student. The teacher of course A evidently has a problem.
Cyan: simulated curve; red: smoothed curve; green: theoretical curve.
Cyan: simulated curve; red: smoothed curve; green: theoretical curve.

Cyan: simulated curve; red: smoothed curve; green: theoretical curve.
Cyan: simulated curve; red: smoothed curve; green: theoretical curve.
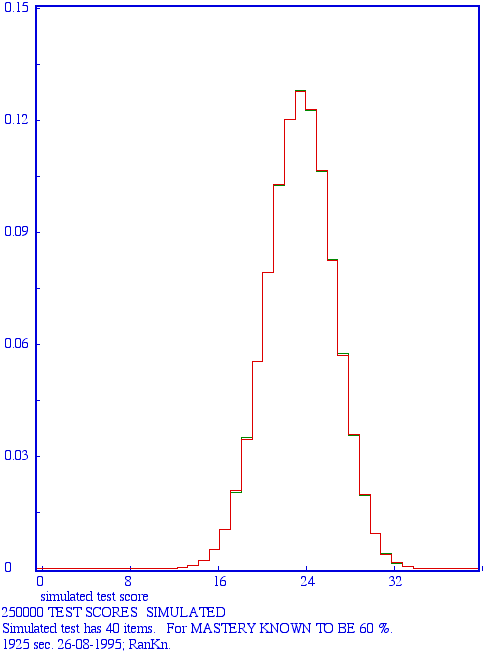
Red: simulated curve; green: theoretical curve. As to be expected with this number of runs, the simulated curve differs only minimally from the theoretical one.
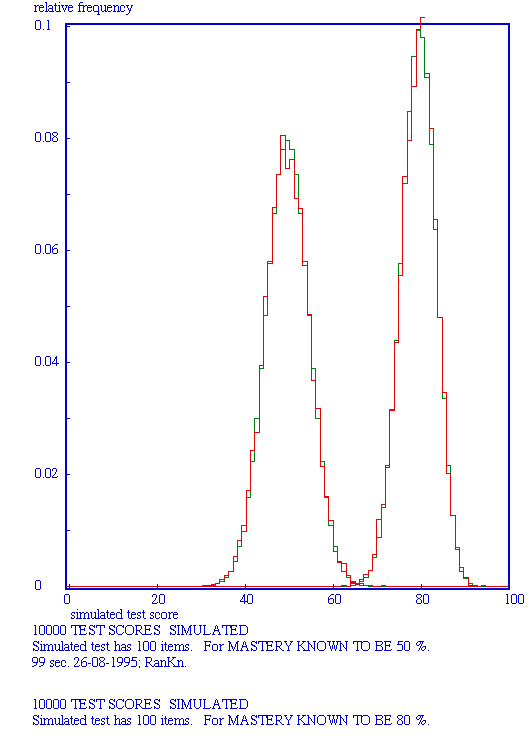
2 x 10000 TEST SCORES SIMULATED Simulted test has 10 items. For MASTERY KNOWN TO BE 50% AND 80% resp. Red: simulated curve; green: theoretical curve.
To retain the flavor of the original posters, the graphics shown in the summary, the paper and the sheets are the original 1995 graphics in gif format. Graphics have not been reconstructed using 2003 software, as has been done in other publications on this general assessment model
Wilbrink, B. (1995). What its historical roots tell us about assessment in higher education today. 6th European Conference for Research on Learning and Instruction, Nijmegen. Paper: auteur. html
Wilbrink, B. (1995). Leren waarderen: de geschiedenis. (SVO project 94707) html
Wilbrink, B. (1995). Leren waarderen: de geschiedenis. Versie met uitvoerig notenapparaat. (SVO project 94707) html
Wilbrink, B. (1997). Assessment in historical perspective. Studies in Educational Evaluation, 23, 31-48. html
Since 2004 the Strategic Preparation for Achiement testing (SPA) model has been implemented in the way of Java applets that will run under your browser. This is one of the major projects on this website: http://www.benwilbrink.nl/projecten/spa_project.htm.
![]() http://www.benwilbrink.nl/publicaties/95AssessmentTheoryEARLI.htm
http://www.benwilbrink.nl/publicaties/95AssessmentTheoryEARLI.htm